mentor.reporting
Utilities for inspecting and visualising mentor checkpoint files without instantiating the model.
- mentor.reporting.get_report_str(path, terminal_colors=True, verbose=False, render_colors=None)[source]
Generate a human-readable text report for a mentor checkpoint file.
Loads the checkpoint with
map_location="cpu"so no GPU is required. Does not instantiate the model class — all information is derived directly from the serialised data.- Parameters:
- Returns:
Multi-line report covering: file size, model class, architecture statistics, training and validation history, software provenance, plottable metric names, inference state inventory, output schema, preprocessing info, and checkpoint contents.
- Return type:
Examples
>>> from mentor.reporting import get_report_str
>>> print(get_report_str("model.pt"))
>>> print(get_report_str("model.pt", render_colors=True))
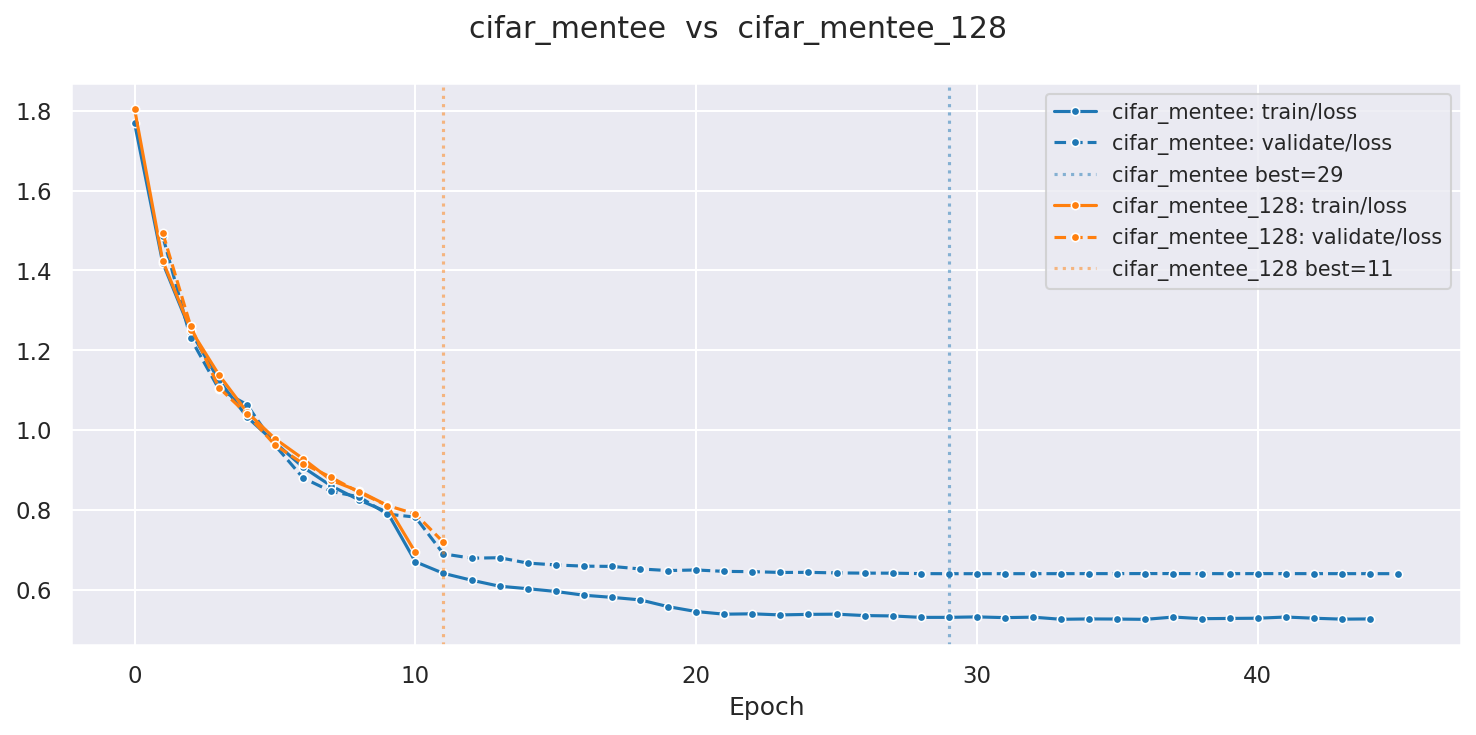
- mentor.reporting.plot_history(values, paths, overlay=False)[source]
Plot training/validation history from one or more checkpoint files.
Checkpoints are loaded with
map_location="cpu"; no GPU is required. Each file gets a distinct colour; each metric a distinct line style. Vertical dashed lines mark the best-epoch for each file when available.- Parameters:
values (list[str]) – Metric names in
split/metricform, e.g. ``[“train/loss”, “validate/acc”]”. Pass an empty list to auto-discover all available metrics (union across all files).paths (list[str]) – One or more paths to
.ptcheckpoint files.overlay (bool, optional) – If
True, all metrics and files share a single axis. IfFalse(default), one subplot per metric with all files overlaid on each subplot.
- Returns:
The composed figure. Call
fig.savefig(...)orplt.show()to display it.- Return type:
matplotlib.figure.Figure
Examples
>>> from mentor.reporting import plot_history
>>> fig = plot_history([], ["run1.pt", "run2.pt"])
>>> fig.savefig("comparison.png", dpi=150, bbox_inches="tight")